Tailored weather forecasts for highway maintenance and snow plowing
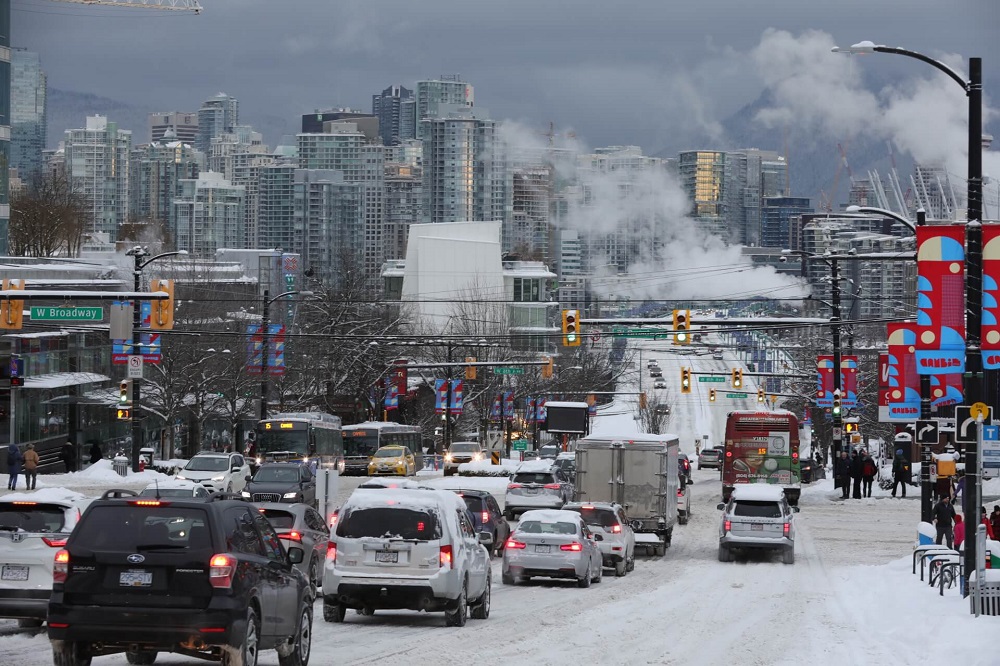
Photo credit: Lasia Kretzel, NEWS 1130

Photo credit: Lasia Kretzel, NEWS 1130

Photo credit: Lasia Kretzel, NEWS 1130

Photo credit: Lasia Kretzel, NEWS 1130
by R. Howard, H. Modzelewski, and R. Stull
Our animated forecast maps showing snowfall provide highway and road services with information to help them plow and carry out maintenance. We also make forecasts for individual locations of importance, and where available, use observations to minimize forecast errors.
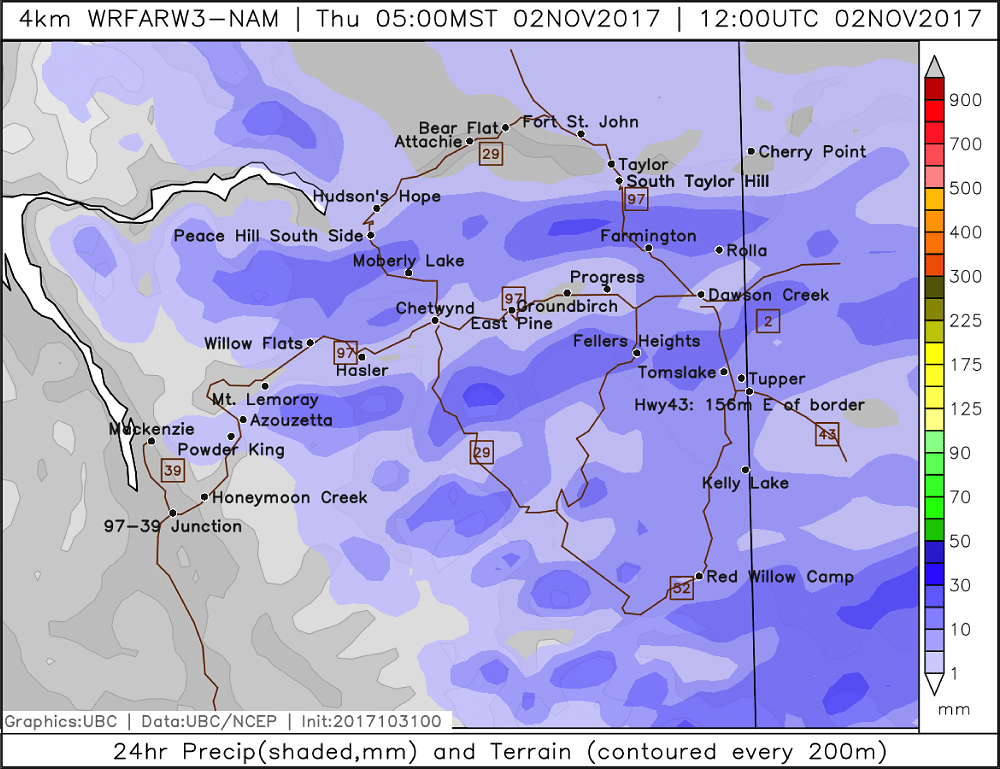
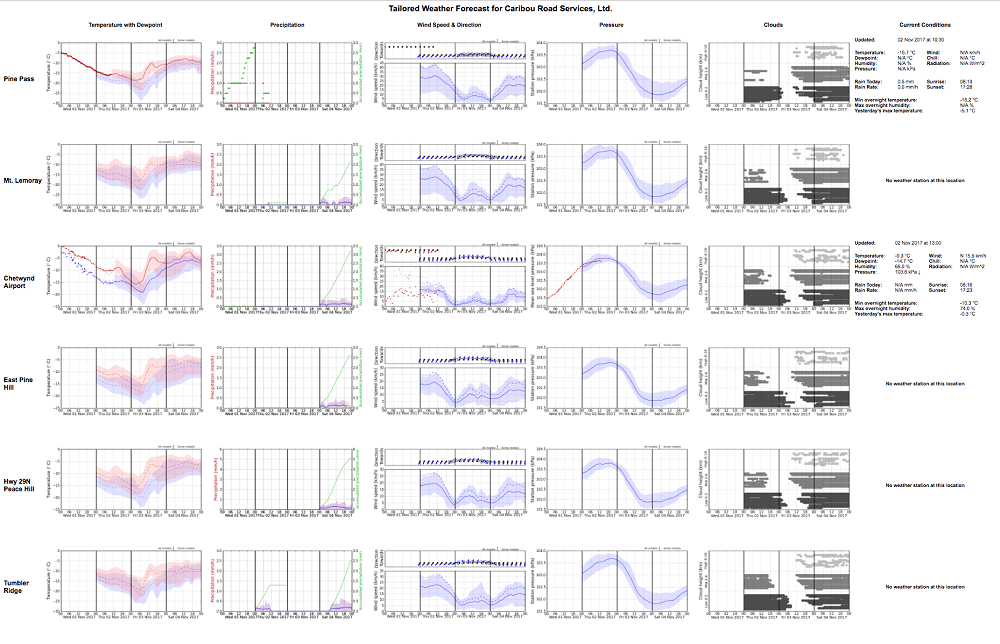
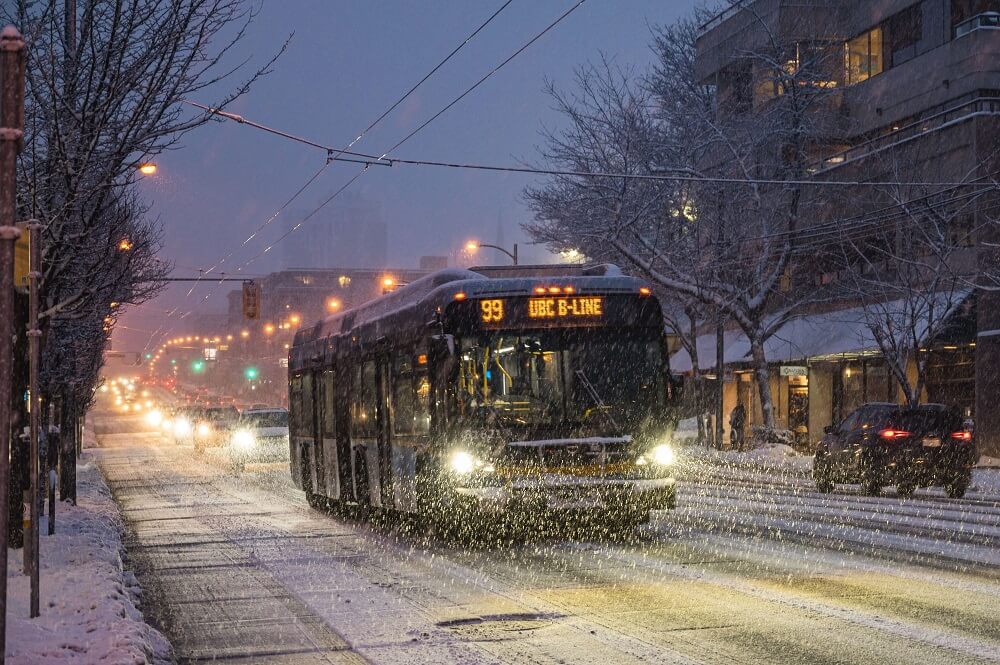
Photo credit: J. Jeworrek
by R. Howard, T. Nipen, and R. Stull
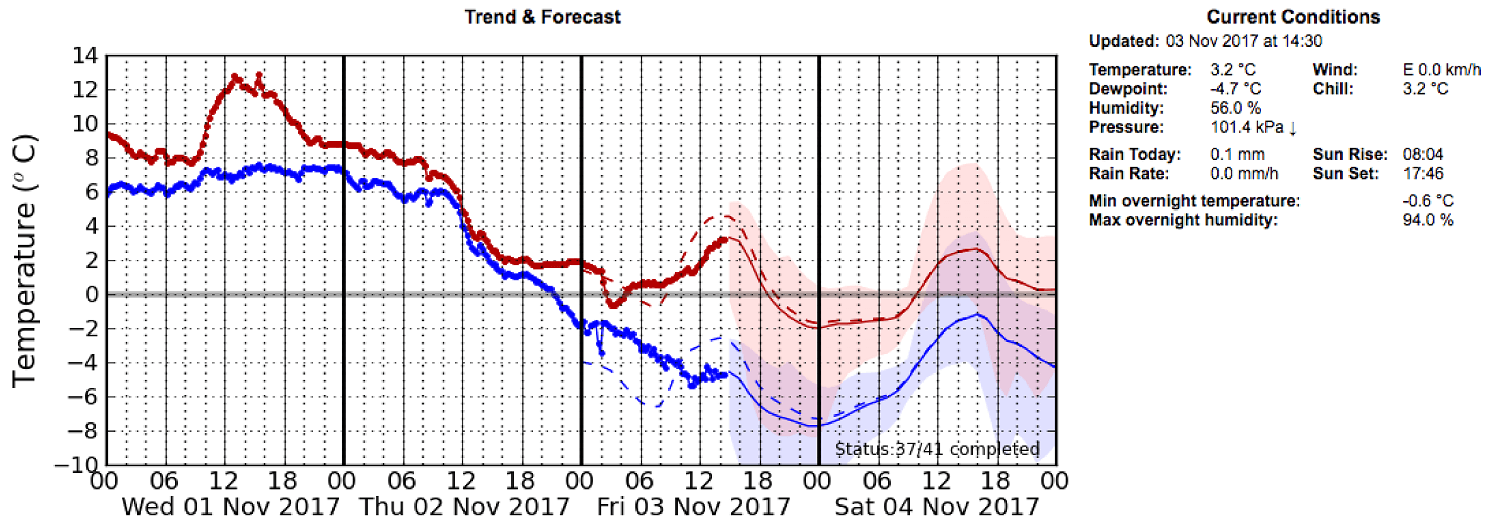
Trolley buses in Metro Vancouver rely on overhead electrical wires and cannot operate if these wires become icy or frosty. We provide temperature forecasts that indicate when these conditions are likely so the wires can be defrosted. We installed and maintain weather stations at key locations across the Lower Mainland in order to provide real-time observations and to bias-correct these forecasts. In addition, our snow forecasts help bus companies manage and operate steep bus routes that serve large articulated buses.
by M. Ribberink, T. Chui, R. Steinhart, H. Modzelewski, R. Schigas, and R. Stull
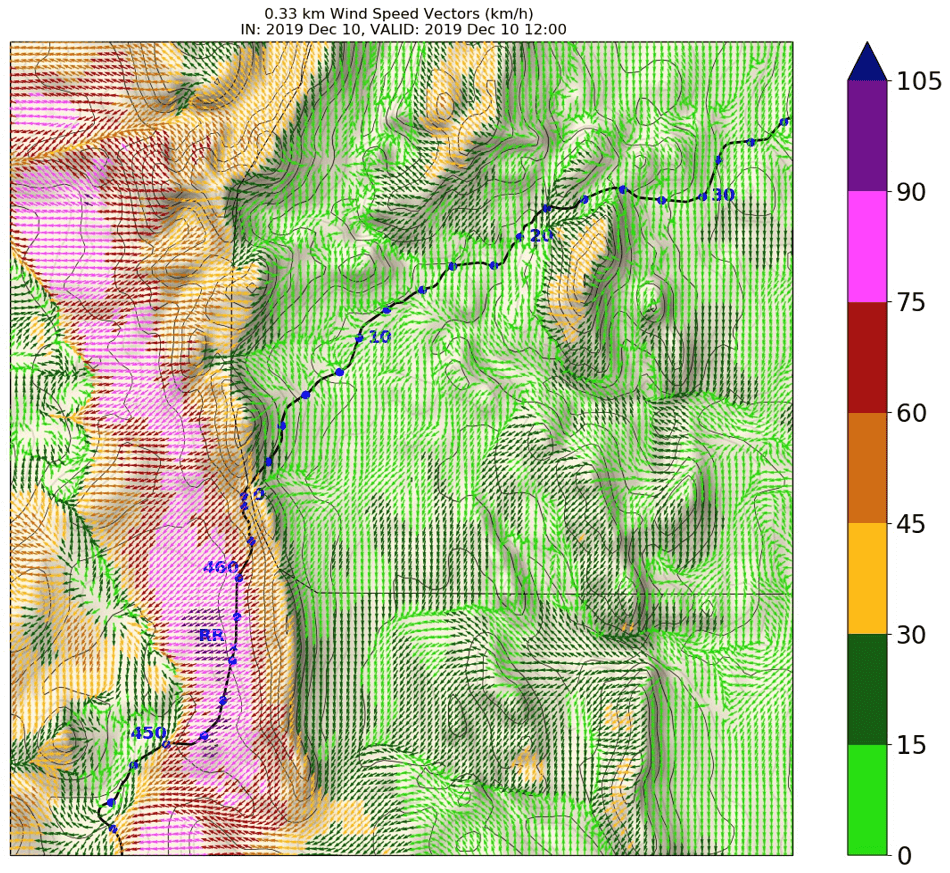
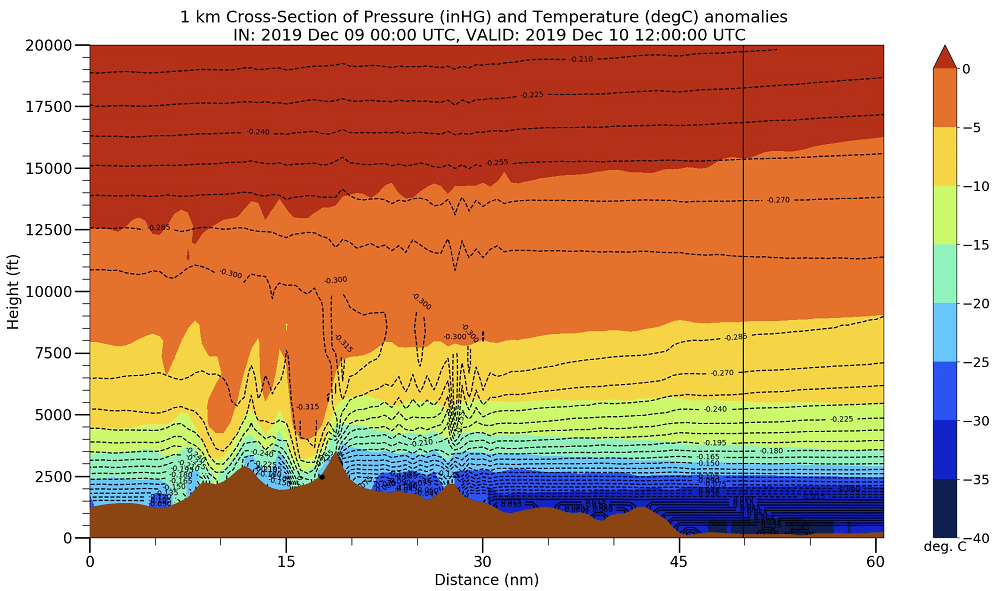
The section of the Dempster Highway known as Hurricane Alley experiences dangerously high wind events, with gusts greater than 110 km/h blowing across the highway. Transport Canada was looking to place a new anemometer in the area that would be able to detect if an event was coming. They contracted our team to determine the best placement of this anemometer. To do this, five high wind case studies chosen from the 2019-2020 winter were simulated using the WRF model. Through the analysis of subsequently created forecast figures, the first four cases were determined to be downslope Foehn (Chinook) winds on the Yukon side of the Richardson Mountains caused by a deep layer of cold air flowing over the mountain top from the east. Case 5 was caused by fast moving air from higher in the atmosphere hitting the mountain ridge and being forced into a mountain wave. We compared our forecasts to the current Environment and Climate Change Canada (ECCC) forecasts and ours were far more accurate each time. Knowing that our forecasts were accurate, we were able to advise on the appropriate placement of an anemometer where it would be able to detect the strong wind events in their early stages and warn drivers.
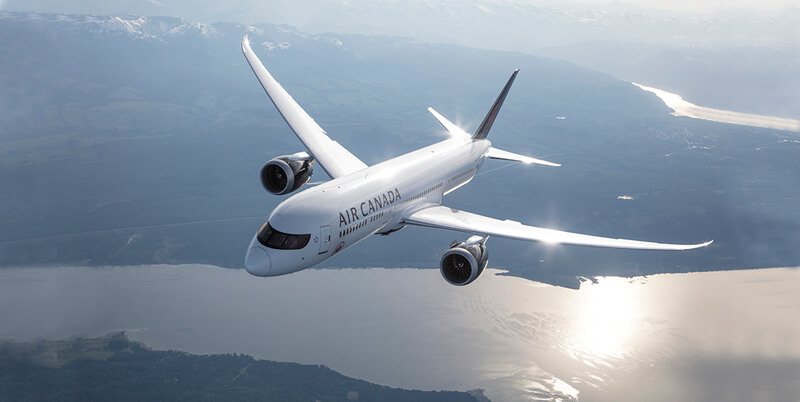
Photo credit: Air Canada

Photo credit: Air Canada
by M. Ribberink, T. Chui, and R. Stull
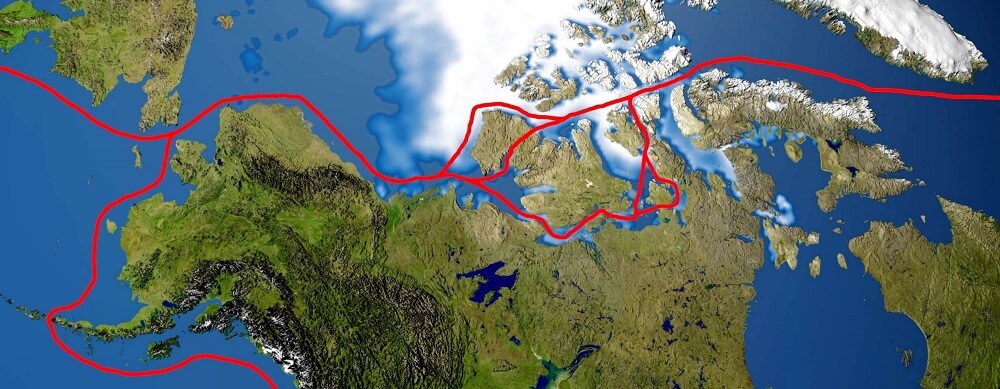
Northwest Passage. Figure credit: Wikipedia (based on NASA image)

Northwest Passage. Figure credit: Wikipedia (based on NASA image)
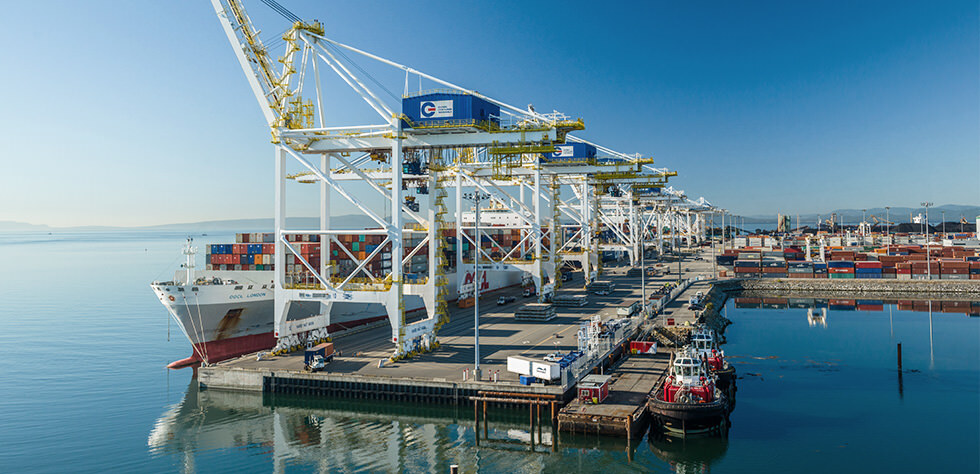
Deltaport. Photo credit: Global Container Terminals

Deltaport. Photo credit: Global Container Terminals
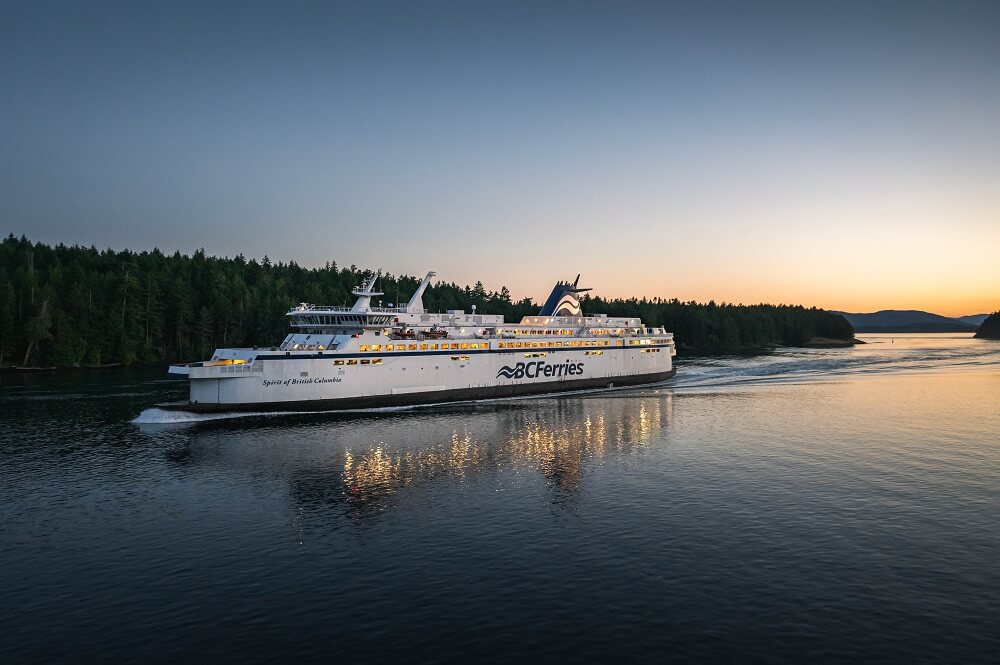
Photo credit: J. Jeworrek

Photo credit: J. Jeworrek
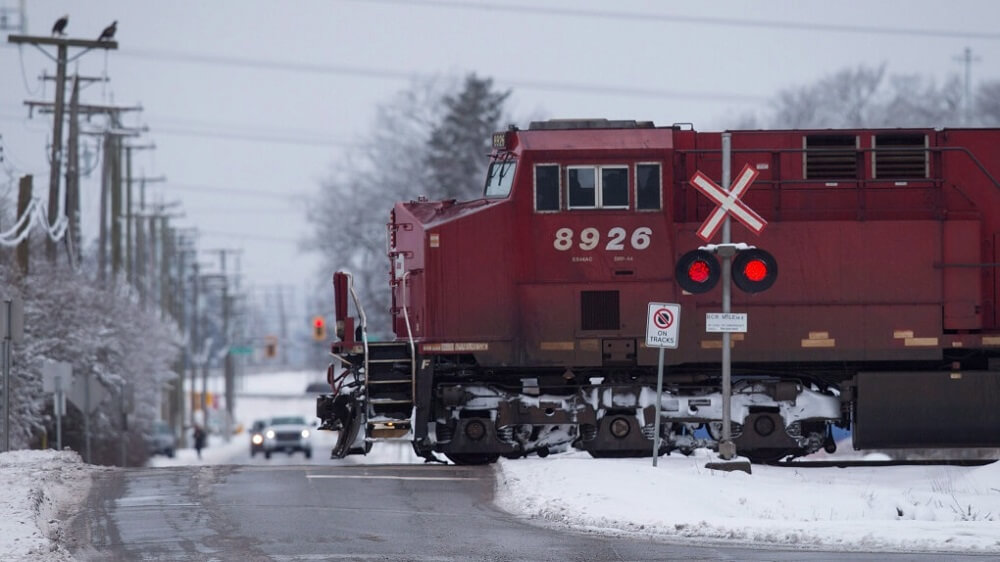
Photo credit: Darryl Dyck/THE CANADIAN PRESS
Our team was providing weather forecasts for some hot box sites, so that the railroad could determine how much warmer the wheel axels were compared to the ambient environment.
Train getting stopped by detector 4 hot box
Photo credit: Darryl Dyck/THE CANADIAN PRESS
Photo credit: J. Jeworrek

Photo credit: J. Jeworrek