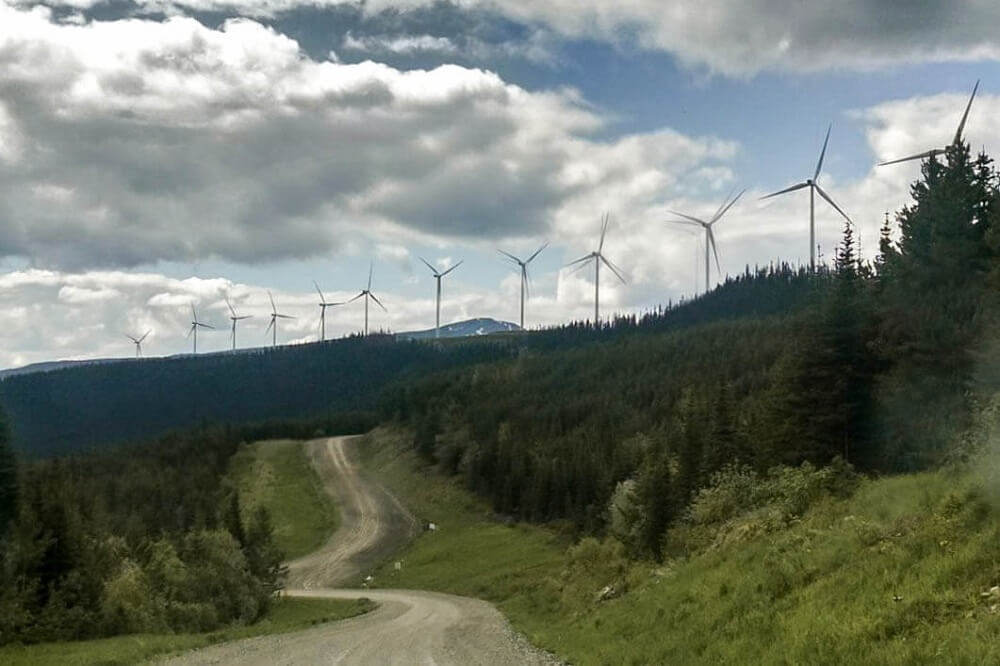
We produce 7-day wind speed forecasts each day for 18 wind farms across British Columbia and in the Columbia River Gorge. As of May 2021, these forecasts are produced using 40 members from the UBC short-range ensemble forecast (SREF) system, using a variety of different weather models, forecast resolutions, and model initial conditions. In the sample forecast shown here, the solid green line is the ensemble mean forecast, representing the average of each of the 40 ensemble members.
We also bias correct our wind speed forecasts using observations at the wind farms (when available). This allows us to create probability distributions around the ensemble average forecast, as seen in the sample forecast here. The percentages in the legend represent the probability that the observed wind speed will fall below the value given by the curve. For example, at the start of the forecast shown in the plot, the ensemble mean forecast is roughly 15 km/hr. There is a 99% probability that the observed wind speed will be less than roughly 28 km/hr, a 90% probability that the observed winds will be less than roughly 22 km/hr, and so on. Text forecasts containing the same information as these plots are also produced.
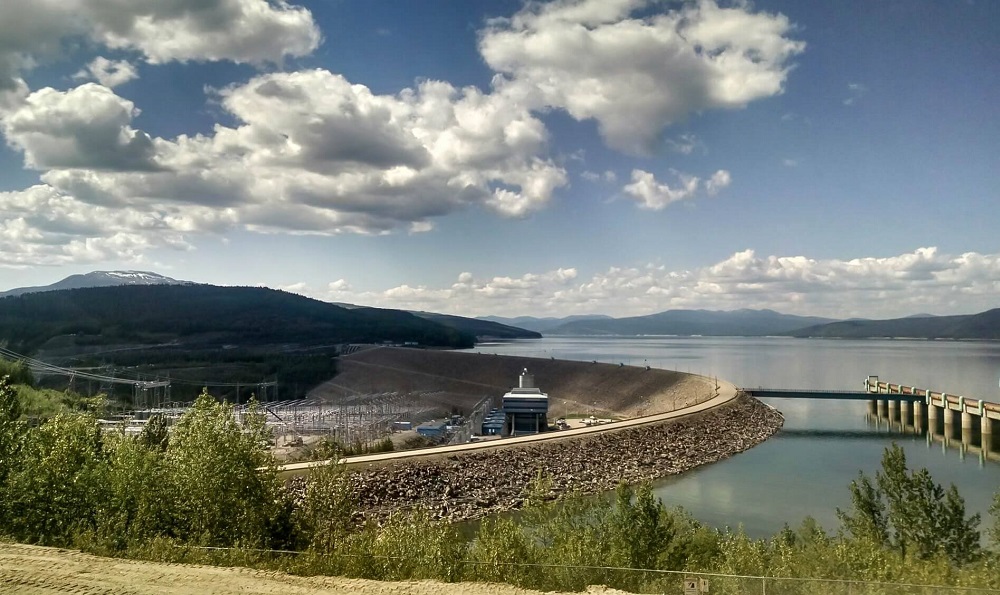
In addition to wind speed, we also produce wind power forecasts and daily energy production (see “Wind power and energy production forecasts”) based on the actual wind-farm power curve (not based on idealized wind-turbine specs).
Wind Forecast Verification for one month (each tick mark on the time axis represents one day).
By comparing wind speed forecasts to observations at wind farms, we can assess how skillful our forecasts are. This process is called forecast verification. Currently, we verify forecasts on weekly and seasonal time scales. The plot shown here is an example of forecast verification at a particular wind farm over part of the winter season in 2021, and shows the ensemble average forecast (in red) plotted alongside the observations from the wind farm. We use many different metrics for verification, including mean absolute error (MAE), root mean square error (RMSE), forecast bias, and correlation. In addition, we can use accumulated absolute error (AAE) statistics over the verification time scale to visually demonstrate for our clients how well individual members of the SREF ensemble are performing.
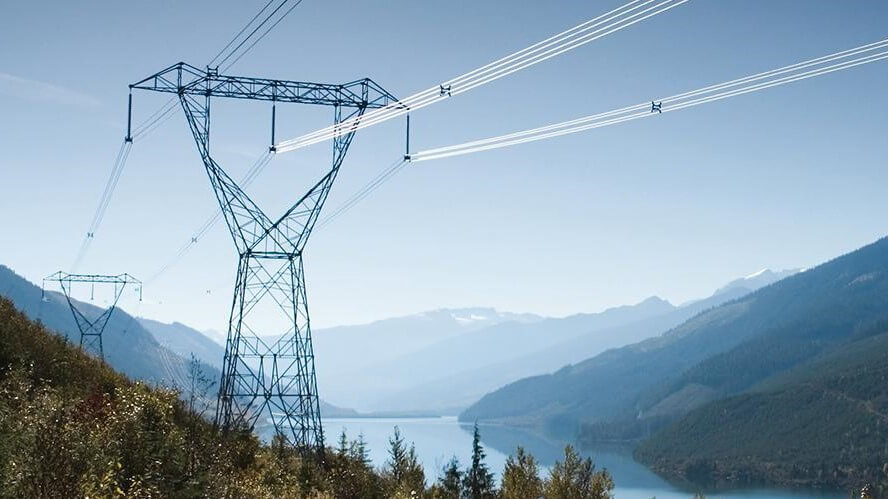
Powerline temperatures depend not only on their transmitting electrical current, but also on ambient wind and temperature. For safety reasons powerline temperatures must stay within a critical limit. This thesis suggests that utility companies could optimize their operations with more sophisticated thermal rating methods to assess the maximum transmittable electrical current.
Dynamic thermal rating forecasts (amperes) along the case-study powerline.
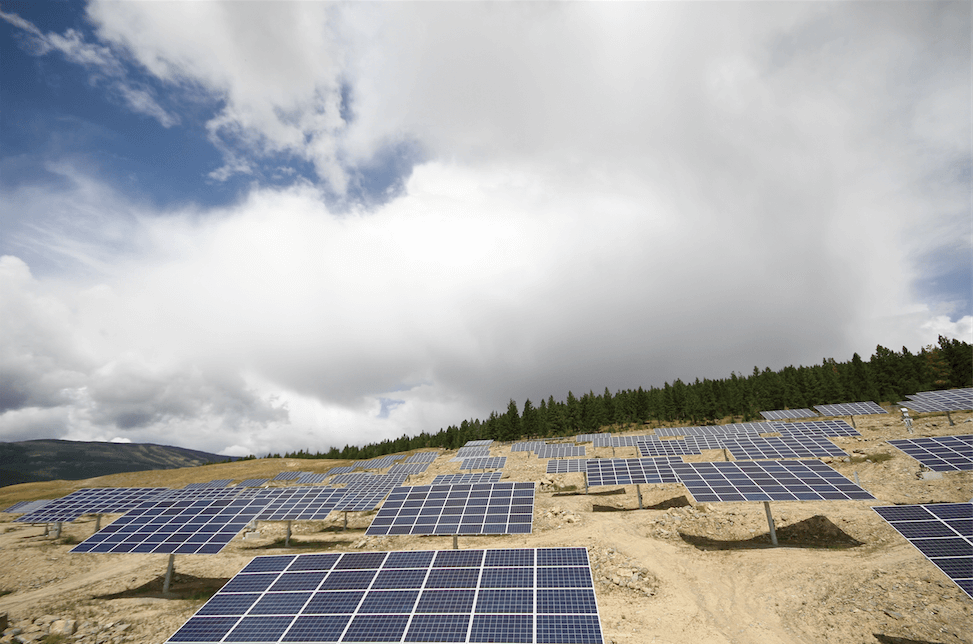
Solar power
Forecasts of sunshine and cloudiness for solar energy farms
SunMine solar farm in Kimberley, B.C. Photo: City of Kimberley
SunMine solar farm in Kimberley, B.C. Photo: City of Kimberley