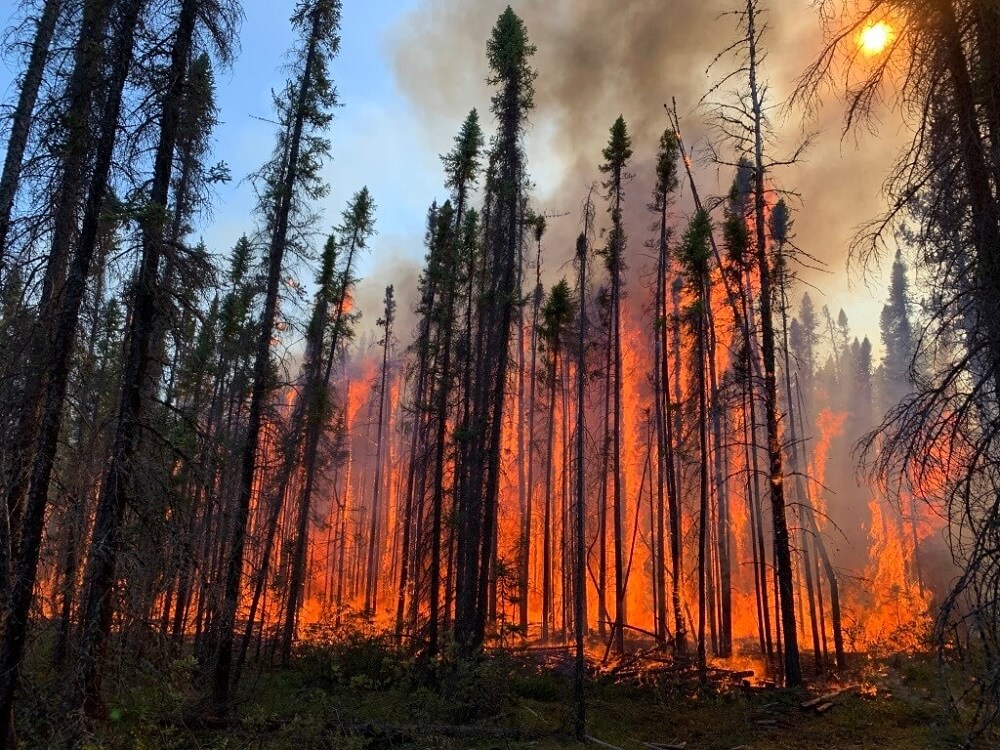
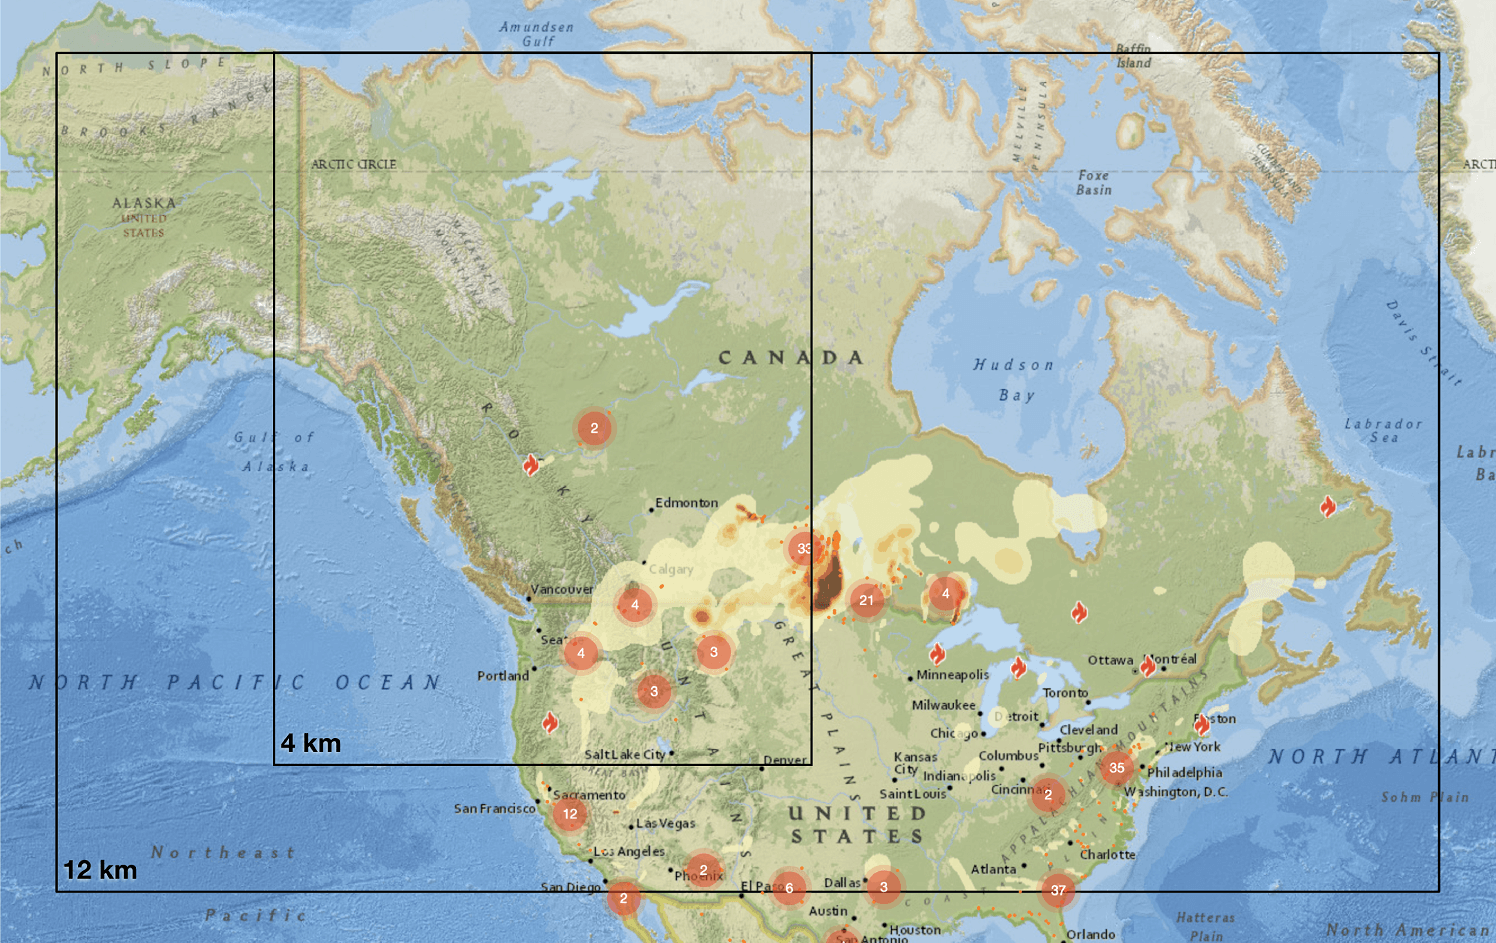
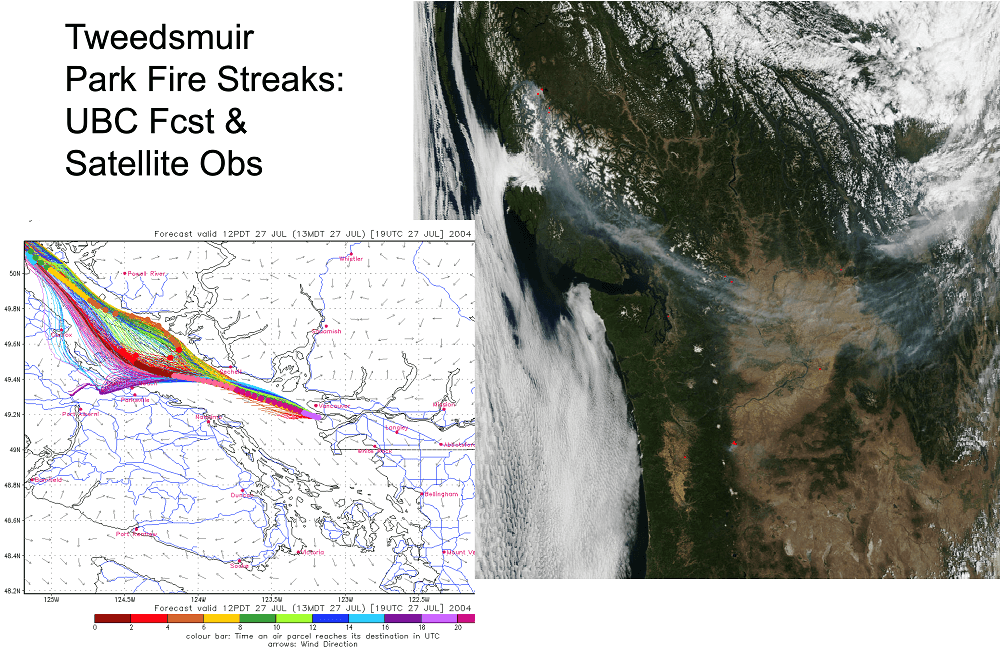
Wildfire smoke creates health issues and affects the safety of Canadian residents and tourists every year. There is a high likelihood that future forest-fire seasons in North America will be increasingly active with high levels of smoke. To mitigate these issues, we have been running the BlueSky smoke forecasting system operationally since 2010. The system uses inputs of fire information from satellite observations and meteorology from our own daily operational numerical weather forecasts to estimate fire emissions, initial smoke-plume rise, and subsequent 3-D smoke dispersion. We display the output of ground-level smoke concentrations on an interactive map available via a public website.
We have two forecast domains, one covering Canada and most of the contiguous US, and one at a higher resolution covering the complex terrain of western Canada.
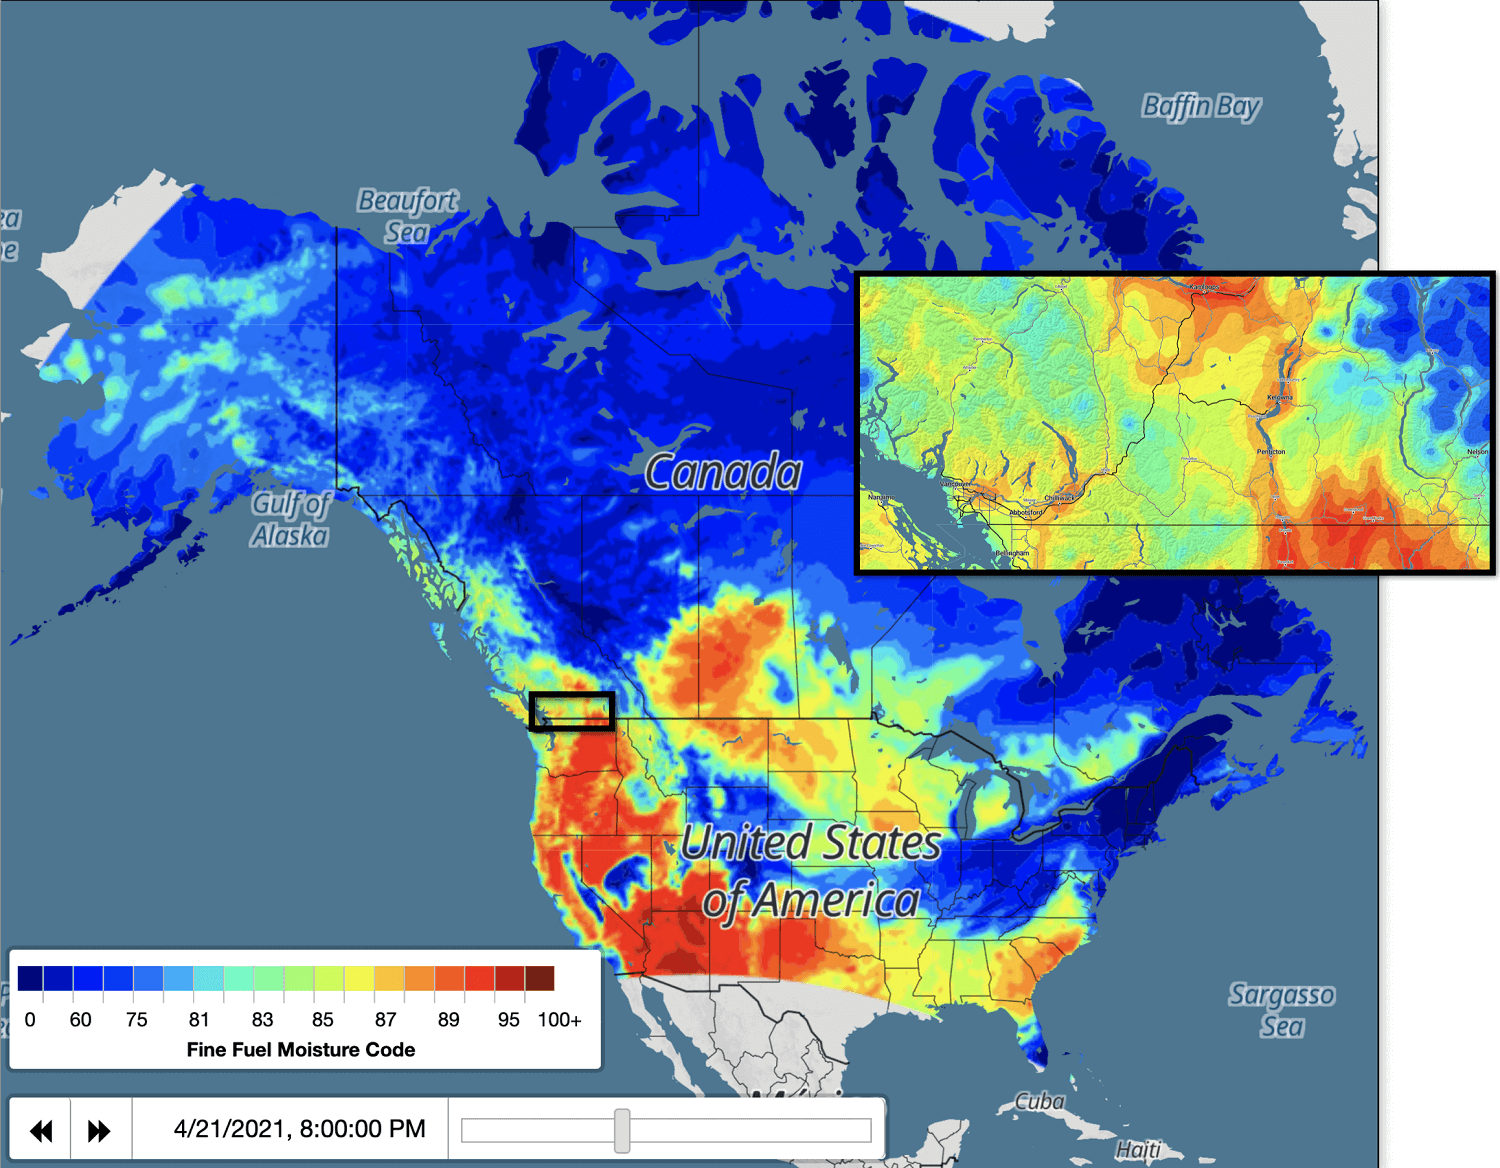
The Canadian Forest Service Fire Weather Index (FWI) System estimates how weather affects wildfire behavior by tracking moisture content in forest fuel layers. FWI forecasts are used by provincial wildfire agencies as input to operational wildfire models to determine how best to deploy limited fire suppression resources.
Our group has developed a new approach, known as the Fire Weather Forecast (FWF) model, which utilizes gridded numerical weather prediction output instead of point-forecast interpolations, calculating fuel moisture codes/indices at every grid point, for both 4-km and 12-km grid spacings. The FWF model provides the more weather-sensitive moisture codes/indices at a one-hour temporal resolution while the less-sensitive codes/indices are solved for once daily at noon local time.
An interactive webpage displays the FWF model output on a zoomable map, popup point forecasts, and active validation against observations. Input from Northwest Territories Government’s wildfire specialists and British Columbia Wildfire Service forecasters helped to develop this new system, to improve the data available for their operational wildfire models and daily incident command briefings.
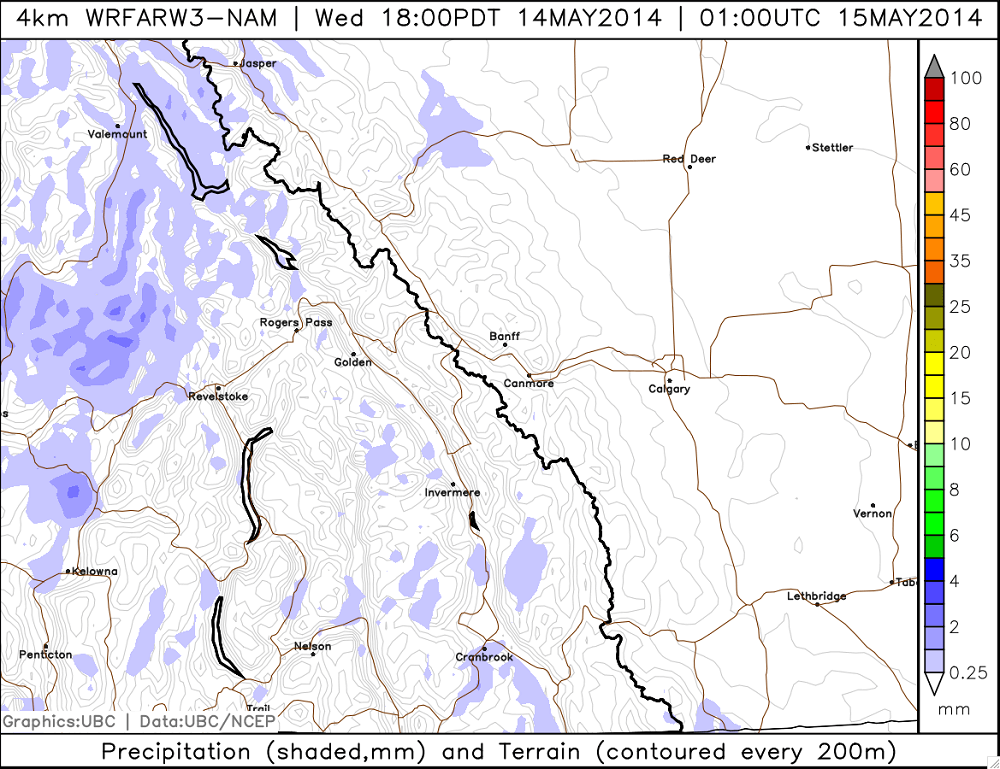
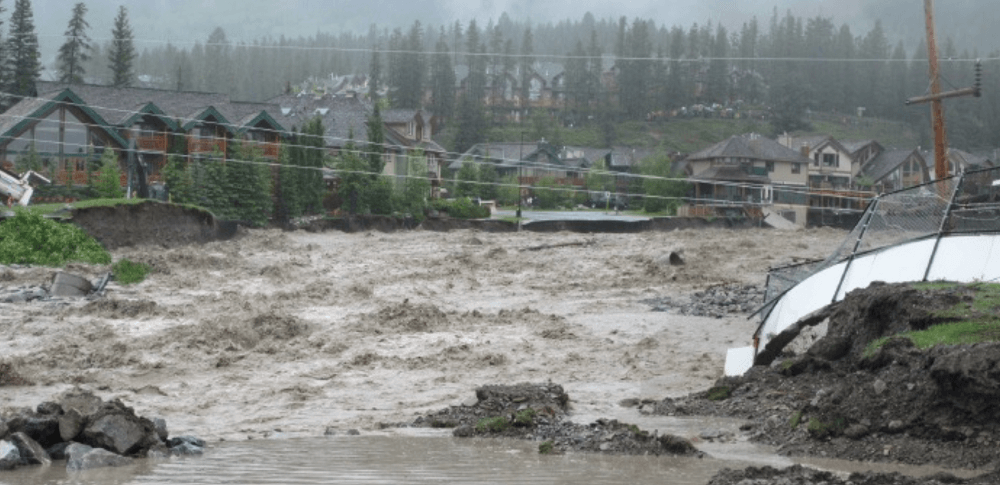
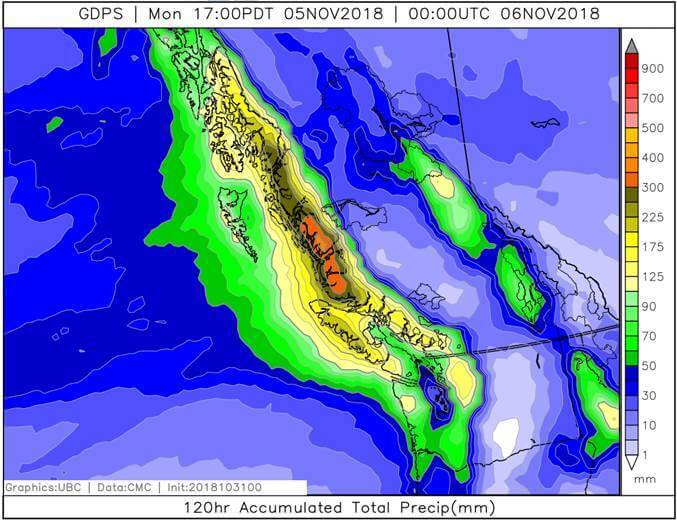
Our high-resolution forecast maps of precipitation help town planners and engineers to prepare for and mitigate flood events. Our gridded forecasts can also be used as input to flood-forecasting algorithms.
Climatological analysis of heavy precipitation events
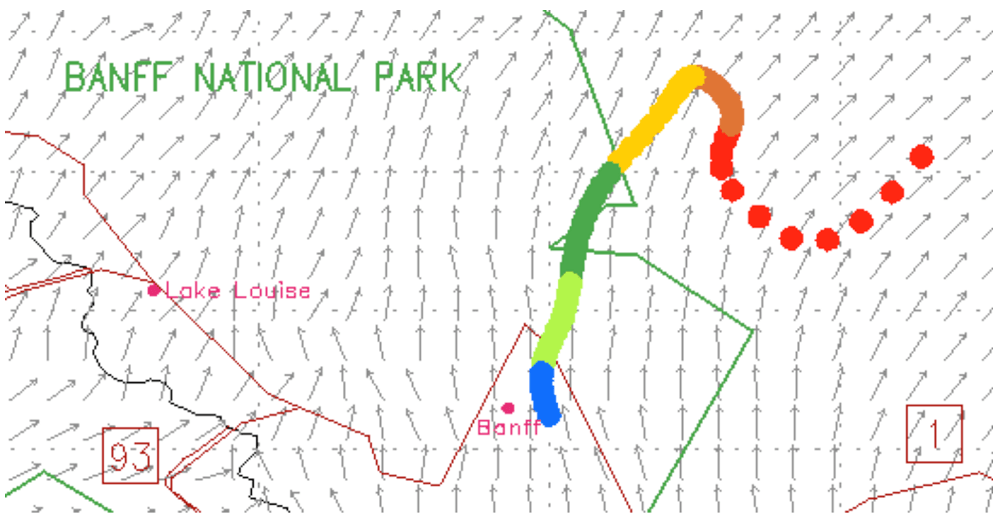
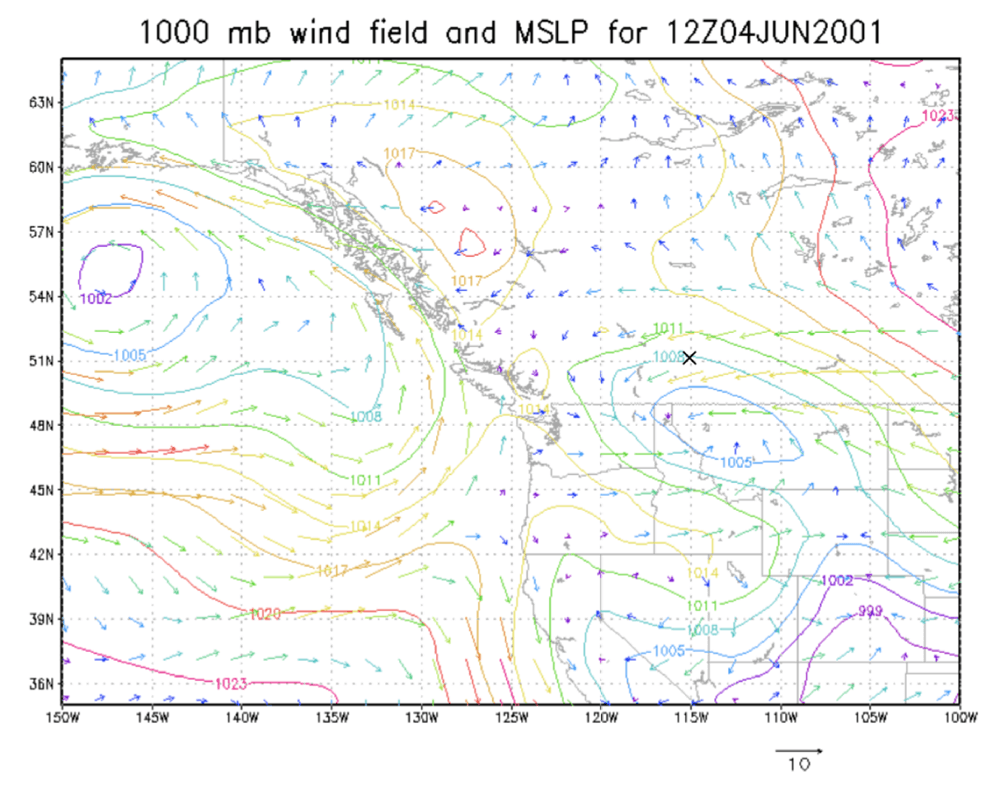
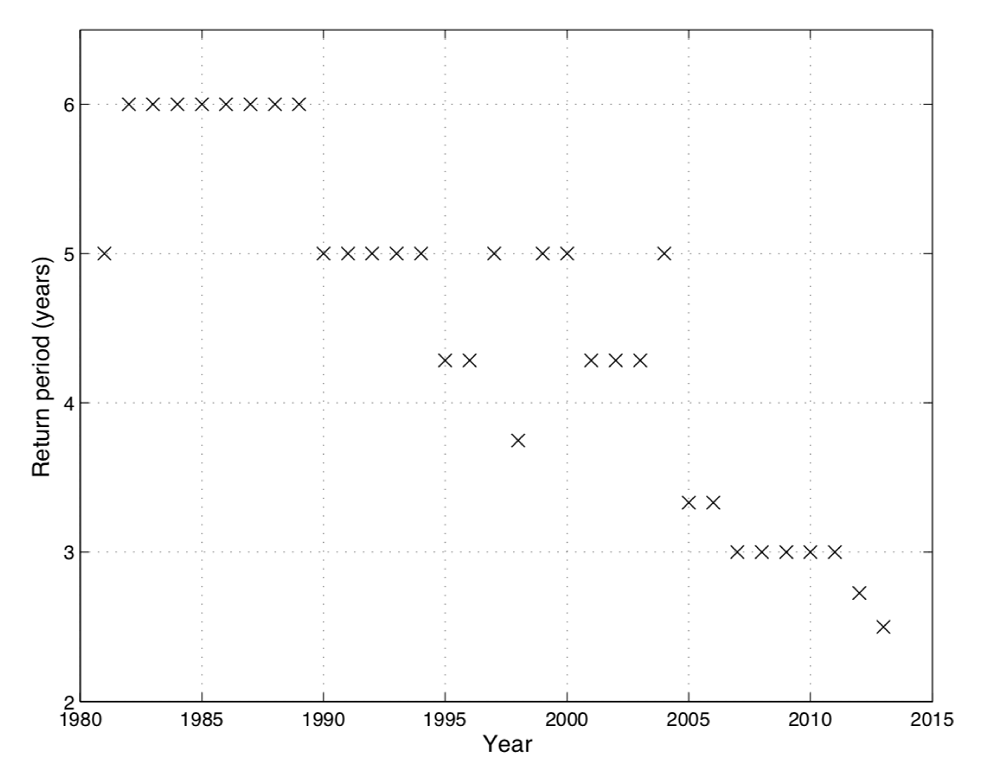
In addition, we have carried out climatological analyses in order to assess the future likelihood of extreme precipitation events, by considering synoptic variables such as geopotential height, mean sea level pressure, wind speed and direction, stability indices, and precipitable water.
For more details see papers by Claudia Roeger (2001, 2003, 2004), as listed in our list of journal articles.
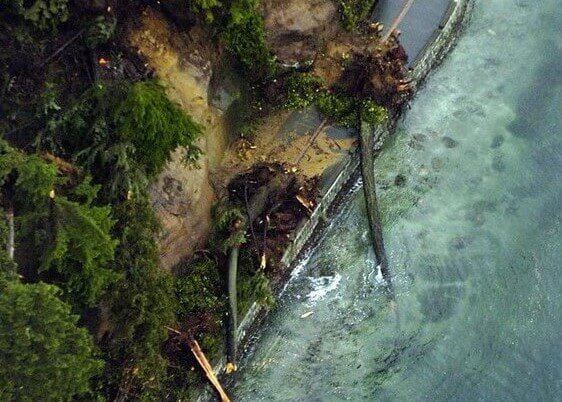
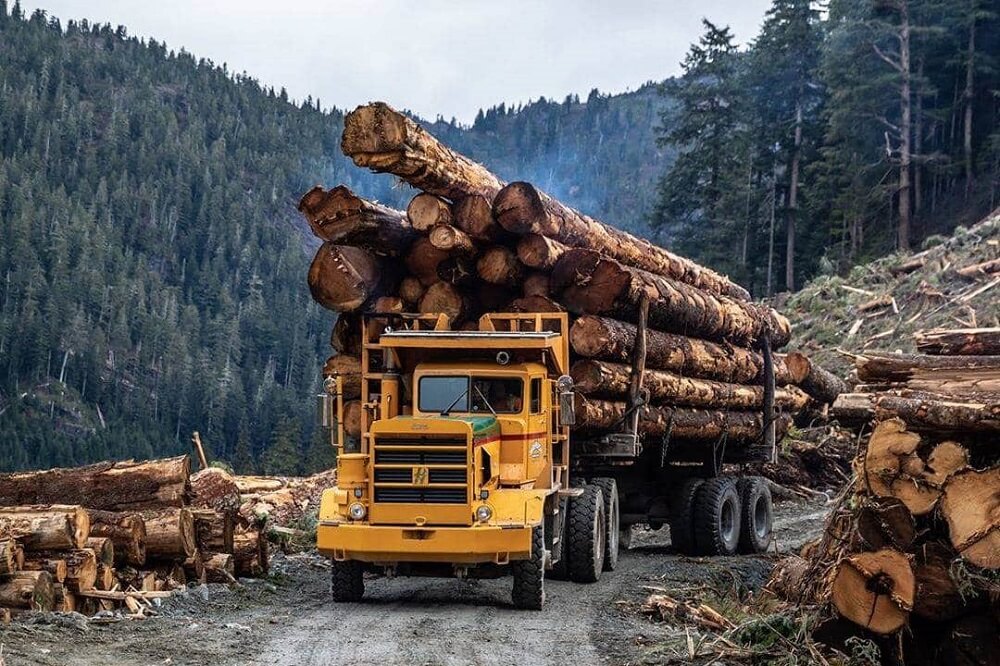
Precipitation hindcasts for shutdown of logging operations
Photo credit: Truck Loggers Association
Learn more!
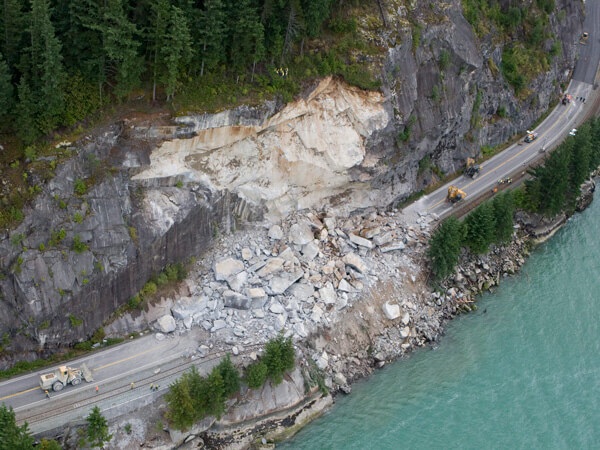
Most logging roads are temporary roads with a surface made of gravel or dirt. The roads cut on the hillsides have little added support from the embankments. Bridges over creeks are often relatively low. Compared to provincial roads, which are designed to withstand a variety of extreme weather, the logging roads, embankments, and bridges can fail in heavy rains.
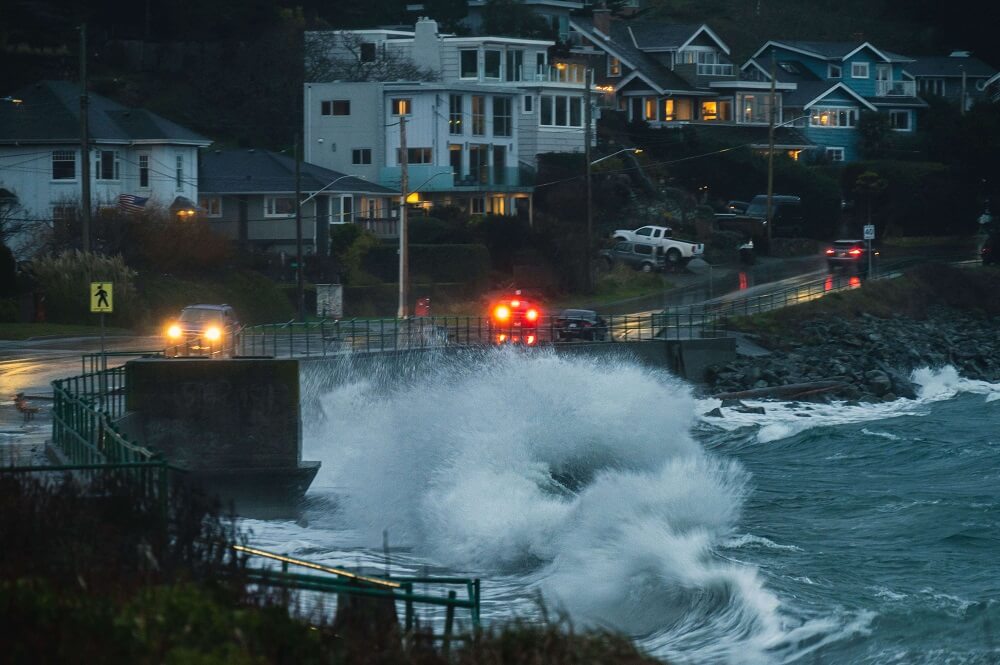
To aid safety in BC forests, the Ministry of Forests provides wet-weather shutdown warnings to the logging operations. For a study of past rain events affecting specific coastal logging sites, we provided historical weather model data to BC Ministry of Forests to compute the likelihood of damaging rain events.
Example of a 5-day accumulated precipitation forecast during an atmospheric river event.
Photo credit: Truck Loggers Association
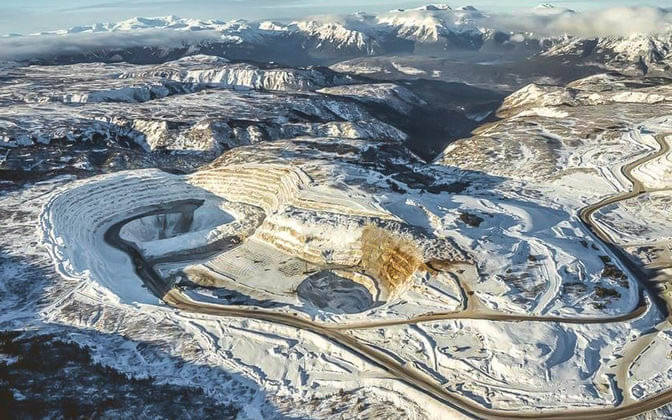
Precipitation forecasts for mining disasters
Intended to provide forensic analyses for floods and tailings-pond failures
The Red Chris copper-gold mine in BC.
Photo credit: Mining Journal
The Red Chris copper-gold mine in BC.
Photo credit: Mining Journal