by R. Howard, T. Chui, and R. Stull
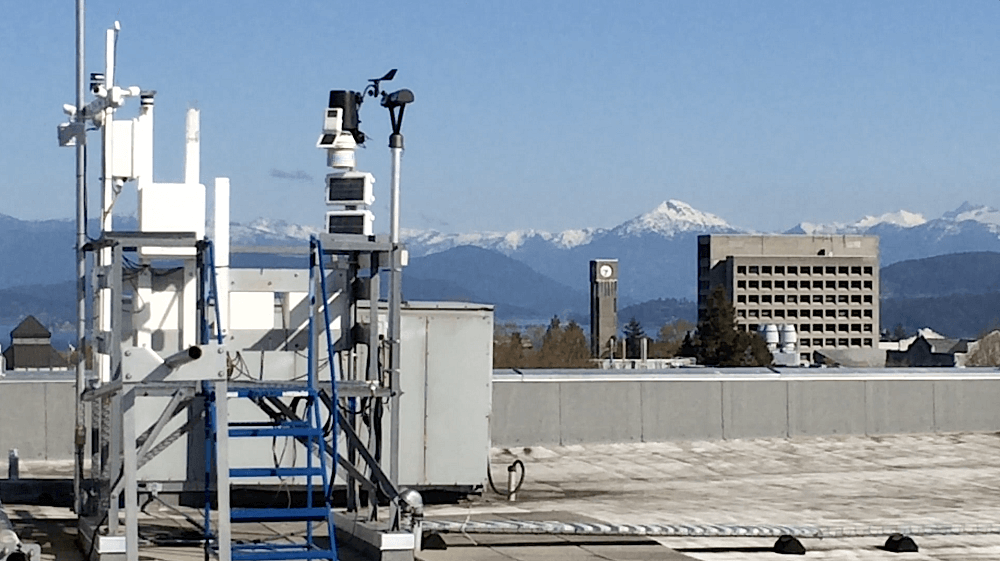
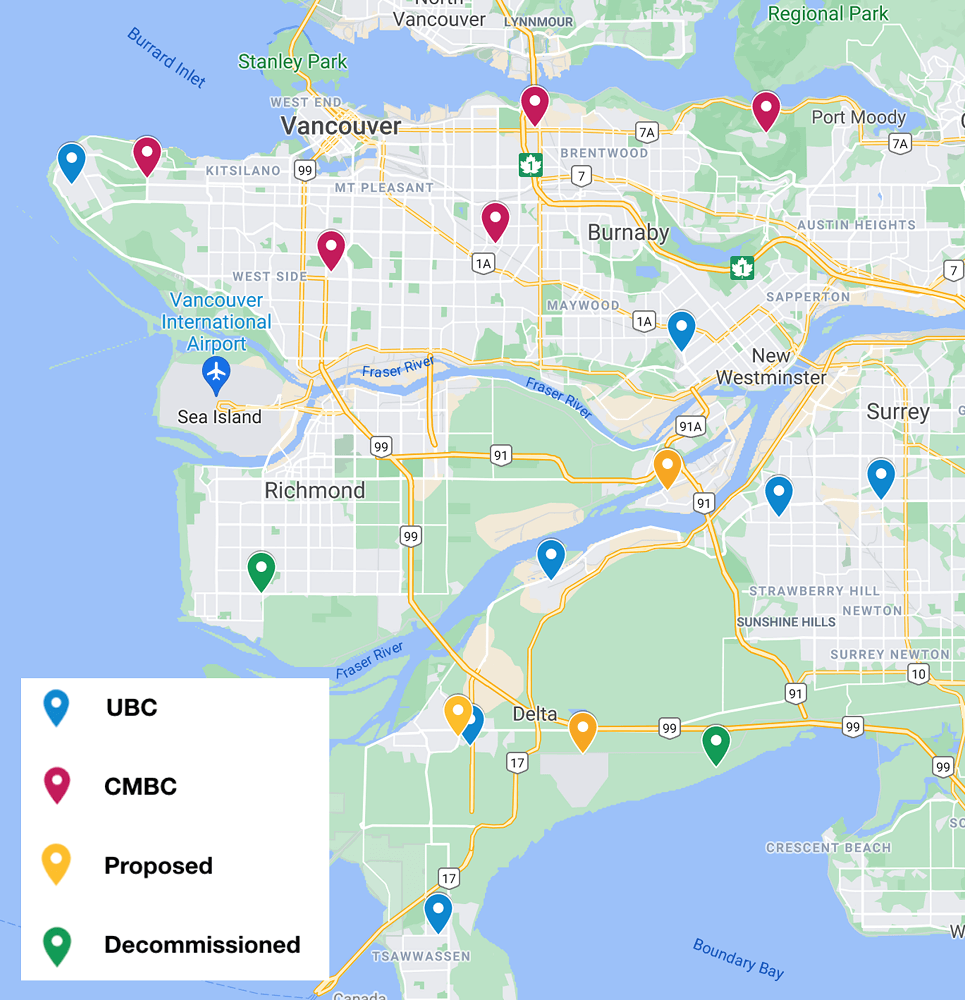
Our team maintains a network of 13 automated Davis weather stations in the Vancouver Lower Mainland. One of the stations is on the rooftop of the Earth Sciences Building at UBC and the data is used to correct systematic forecast errors. Five of the stations help to provide information to the Coast Mountain Bus Company for predicting frost on bus trolley lines, and snow on steep bus routes that large articulated buses need to climb. Most of the remaining stations are on firehall rooftops. Fire departments use them for temperature and winds and in return we can install our instruments in secure rooftop locations.
The WFRT has a variety of field equipment and expertise that allows us to participate in a variety of field programs. Here is a partial list of equipment.
Abbreviations: CS = Campbell Scientific
Full weather stations
Precipitation
Temperature
IR Thermometers
Humidity
Radiation
Pressure
Winds and turbulence
Air Quality
Special sensors
Upper Air
Data loggers and field computers
Plus many instrument shields, shelters, enclosures, masts, electric generator, tools, etc.
by C. Rodell, N. Moisseeva, R. McKinney, R. Howard, and R. Stull
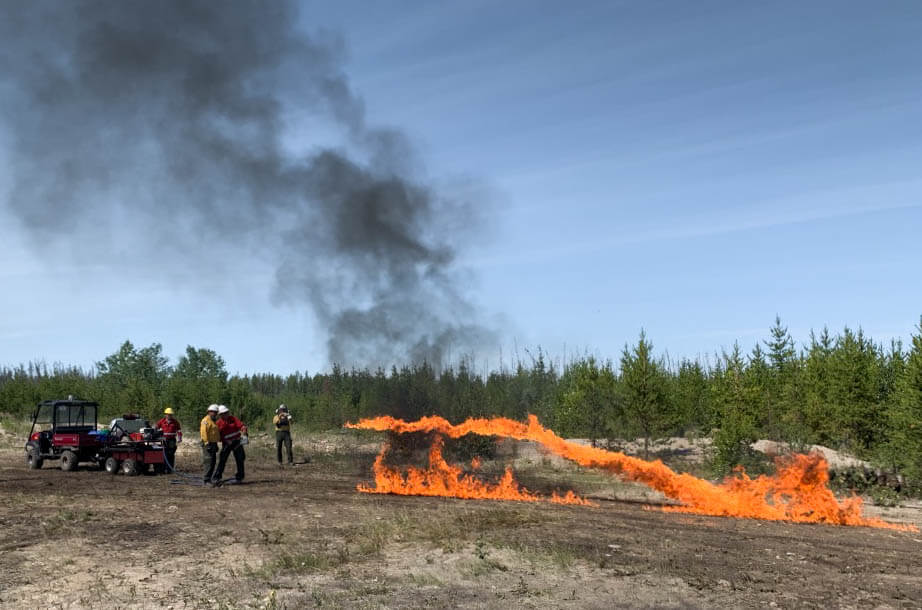
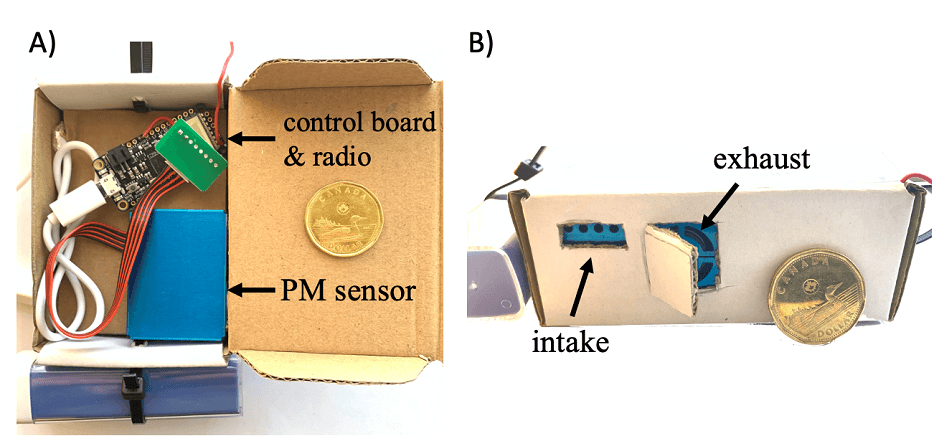
Our group participates in controlled burns to collect data and deepen our understanding of the coupled atmosphere-wildfire dynamics. Our primary focus is on smoke plume dynamics, specifically the vertical distribution of smoke concentrations. To capture this, our group has developed an expendable sensor measuring particulate matter. Each sensor is treated as a radiosonde or dropsonde to make in-situ observations of PM [1, 2.5, 10] concentrations within controlled burn smoke plumes. The sensor will be attached to a Windsond radiosonde instrument providing concurrent measurements of temperature, dew point, and wind speed and direction. Along with the smoke concentration measurements, this combined instrumentation will provide a much-needed dataset to evaluate smoke plume rise modeling.
Test launch from Harrison Lake
Test launch from Harrison Lake
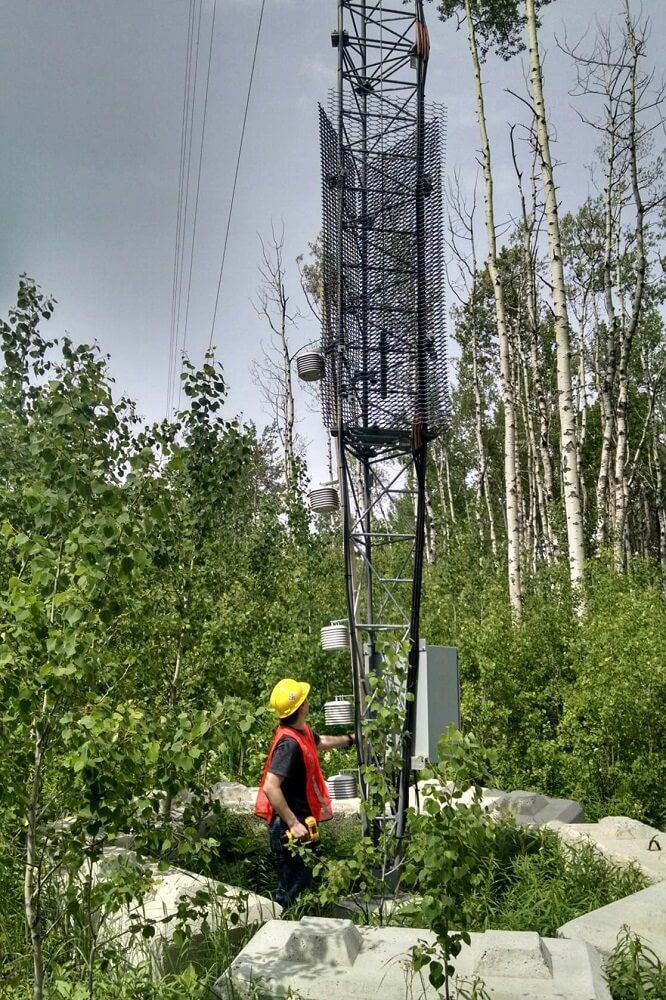
Photo credit: G. West
by D. Siuta, G. West, R. Howard, and R. Stull
This field campaign evaluated physical modeling approaches known as flux-profile relationships, which describe vertical wind and temperature profile shapes in the lowest levels of the atmosphere. Such relations are used by all weather models to parameterize vertical transport of momentum, heat, and moisture, and play a key role in correctly predicting wind speeds at wind-turbine hub heights (approximately 80 meters above ground level). The campaign evidenced here sampled wind and temperature profiles directly at wind farms in British Columbia’s mountainous terrain and found that commonly-accepted profiles like the Businger-Dyer relations do not apply along ridge tops under statically-stable conditions at the locations tested. A new flux-profile relationship valid along mountain ridge tops under statically-stable atmospheric conditions was devised using one year of data sampled at approximately 10 minute intervals using Onset HOBO Temperature and RH loggers. Such instrumentation provided a unique solution that allowed UBC researchers the ability to sample data at a high frequency in areas void of cellular and internet services.
Photo credit: G. West
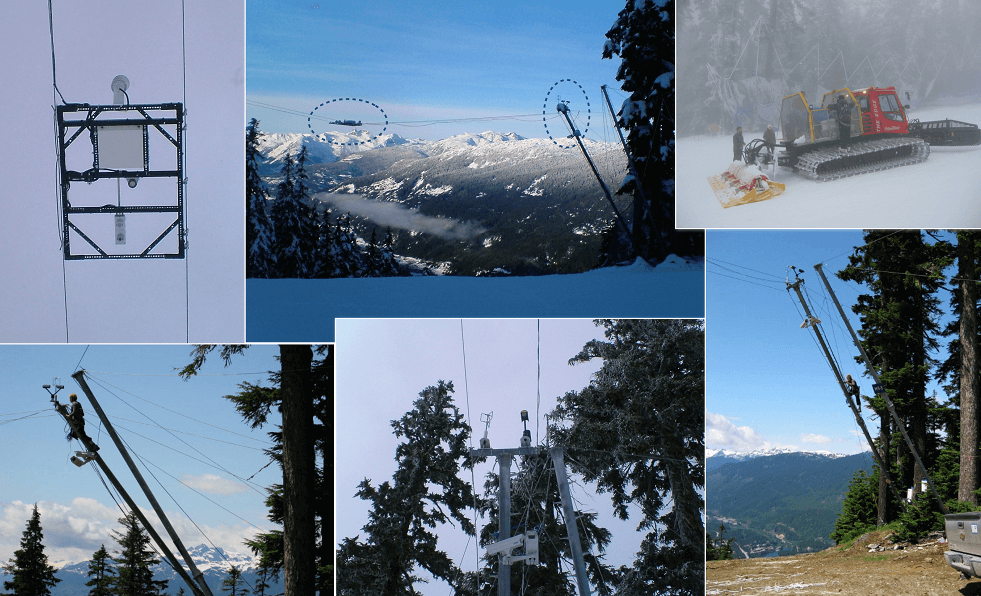
Photo credit: R. Howard
As part of our 2010 Olympics research and operations project, we built and installed a weather station on Whistler Mountain located on the “Dave Murray” men’s downhill ski run, using research-grade instrumentation. The research goals are described here. Data from these instruments were used as input to a numerical snowpack model that simulates snow temperature and liquid water content. Most instruments were suspended directly over the ski run to “experience” similar conditions as the snowpack beneath a ski racer, in terms of the weather and radiation effects (from surrounding trees and other objects) that influence the variables being modelled.
Photo credit: R. Howard